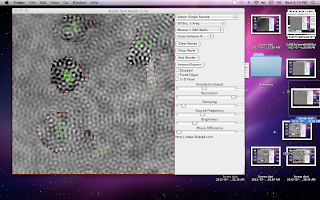
Please excuse the distractions on the right hand side of the figures, just uncropped snaps from my desktop.
The following series of snapshots of dynamic iterations of wave interactions suggests that emergence can be emulate with a nemetics simulator. Still much to investigate but the direction seems fruitful.
The central Nemetical insight was developed by Dibyendu De He was first to frame Complex Adaptive System as interactions of Red, Green, Blue Waves. The metaphor is best represented in this graph.
The graph can be mapped to reality in many ways. Dibyendu has the experience, insight and talent to map to mathematical rules.
Consider the square of the figures below as the field of focus. At the top level - the Blue wave is closed ( indicated by the red boundary on all four sides. Each internal nShape is "open" with different characteristics of "open" in each case. (edges within edges.)
The points is the source of Events. Each beat of the frequency is an event - the R wave.
The black and white patterns are the Green wave - observable behavior of wave interactions with in the scale of interest.
Unfortunately the model needs to be modified to be optimize it's ability to model nemetic interactions. One would like the ability to set the frequency of each point independently. One would also like to be able to change the walls while the iterations are playing out.
My conjecture is with these and some other small changes it will be possible to model nemetical interactions at every scale for every Complex Adaptive System.
The Set Up
The red lines and green points are set by hand.
The right hand panel shows the setting of the parameters.
The right hand panel shows the setting of the parameters.
Figure 1 Time x
Figure 2. Time: x + a
Figure 3, TIme x + a + b
Figure 4. Time x + a + b + c
Figure 5. Time x + a + b + c + d
Figure 6. Time x + a + b + c + d .....n
End State
Three different 3d Views of End State


This is cool. Clearly there are 2 portions of the story that come out clearly. Through the interactions within the closed space there are regions of sync in some pockets, though few(seen in the 3D pics) and many 'diffused areas', which represents the limiting case for the numerous interactions taking place.
ReplyDeleteThis model is great since it somehow depicts millions of interactions taking place in a space over time.
From the pics we can possibly see two important things:
1. There are areas of sync where the oscillators start dancing in sync though some of them are still out of phase (may be they would come in phase 'lock step' after we allow more time). This is the perfect pic of either competition or co-operation without a leader or hierarchy (spontaneous/self organizing) connected by nothing but waves (may be the B or G to create the R pockets).
2. The other part of the pic depicts the limiting case where the oscillators completely ignore one another. Hence they show up as 'diffused' areas all over the space (wondering whether it is possible to introduce more oscillators as time passes -- would be interesting to see that case). Anyway, what results is incoherence akin to the behavior of arrhythemic heart or seizure. In other words it might represent the pic of approaching death owing to non-adaptation.
From these lovely pics I think we can find the ratio of 'adaptation' to that of 'non-adaptation' and the strength of that adaptation, which might be amplitude (a property of G wave) for a given 'frequency' (B wave)within a defined space operating dynamically.
These pic are important since till date there is no model that shows coherence (sync) and incoherence (diffused areas) emerging at the same time.
Hence this might be close to explaining many phenomena (nature, organization, diseases).
Thank you so much for this brilliant post.
Coming from you that means a lot. Thank you. I've seen limitations of the simulator that could make it a more robust tool. I think I can find the java code that underlies it. I will take a look and post in the comments when I find them.
ReplyDelete