Monday, December 16, 2013

Experiment 12.16.2013 Searching for the Gwave


In the sketch below, Bwave is set to frequency 200 sine wave. The Rwave is set to 201 frequency sawtooth. The Gwave is generated by summing the top and bottom waves.


Saturday, December 7, 2013

WVE: 100E + 85Ex

60 second view

30 second view

15 second view

7 second view

1 second view

0.5 second view

WVE 1 of series xE + yEz at z seconds

100E + 70Ex at 30 seconds


100E + 70ex at 7 seconds

100E + 70Ex at 3.6 seconds

100E +70Ex at .125 seconds


Thursday, December 5, 2013

WVE Small changes lead to big effects..


Frequencies 440 + 440.5

Frequencies 440 + 442

Frequencies 440 + 448

Frequencies 440 + 465


Tuesday, November 19, 2013

WVE - Different Views of the same structure

A thanks to Alex Gagnon ( @antisignal on Twitter ) for pointing me to the zoom tool in Audacity.  Using the tool is a nice way to show that what one Notices in a complex system is sensitively dependent on the resolution of the lens one uses.

The following pics are exactly the same structure.


Monday, November 18, 2013

WVE Nemetic Sketch of a C major chord

Frequency values were taken from  Frequencies for equal-tempered scale

The wave forms are at .5 seconds from a one minute clip. Top band is C, middle band is E, third band is G. Fourth band is the sum of the waves.

Harmonics?


Saturday, November 16, 2013

WVE - Iterations of the RGB wave

Just a sketch. In each set of three waves, the bottom one is the summation of the first two in the threesome. It goes to humility in the face of intervening in complexity.


Friday, November 15, 2013

The Power of Notice - Experiment WVE.11.15

A sketch:

The faster ( closer ) one Notices, the easier it is to find the intervention to calm the waves.


at 1 second

at .5 second

 .25 second

.125 second

.065 second

.035 seccond

.0155 second

.008 second

.004 second


Interative Summing Waves WVE 11.13

A quick sketch.

We are looking at the effect of iterative summing of Rwaves. Figure two takes the last two lines from figure 1 and sums them. The same process is repeated until figure 5.


Tuesday, November 12, 2013

History the Nemetics Way Experiment 1

Please note this is the very first of what I hope will be an ongoing series of experiments in the service of understanding the flows of Complex Adaptive/Creative Systems. For now it's merely the explorations of the tool and could be best considered as sketches. Going forward the hope is to use this approach to map "big data" to the wave forms.

Below is a wave diagram created using the Audacity application.  A thank you to +Alex Gagnon for his work and pointing to the app. I also want to acknowledge +Dibyendu De for his thought leadership for the Nemetic Theory. 

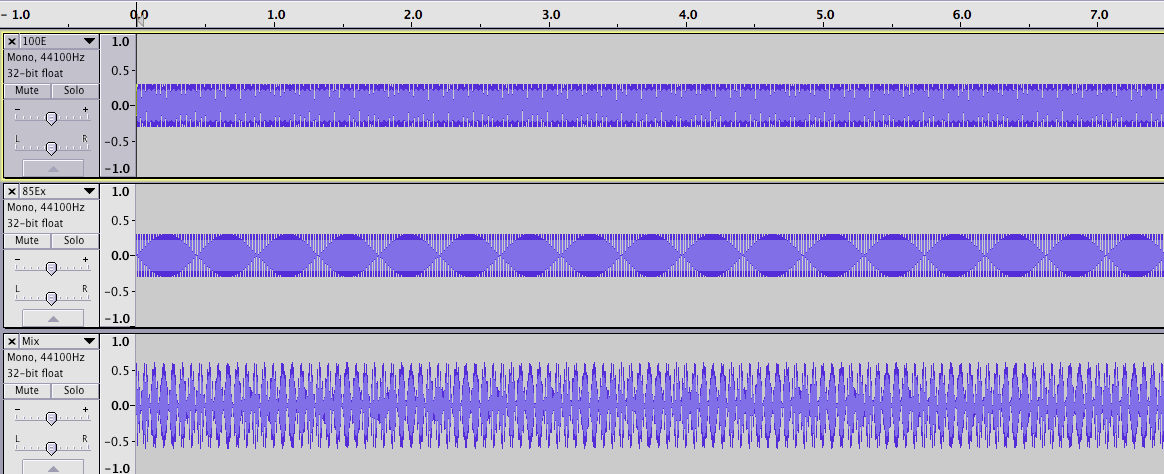
The diagram below is meant to emulate three waves that are important in human history. The top wave - the Rwave - are meant to emulate violent events. The square waves are meant to emulate wars.  The second wave looks at migration, especially the migration from rural to urban centers. The third wave tries to capture Schumpeter's 50 year cycle in economies.


The period under examination is roughly from 1900 to 1960+. In the Rwave ( top ) the square waves are approximately World War I and World War II. The second wave is a first approximation of capturing some of the waves of migration. The first increase in Amplitude is from the rural South to the urban North. The second increase in amplitude is the larger migration from the rural South to the urban North.

Below is the Bwave that tries to make visible the Zeitgeist as we move through the 20th century.


Any thoughts or suggestions are much appreciated.

Sunday, November 3, 2013

Nemetics Images? changing the color.weight, shape


Using simple color manipulation tools one goes from A to B or C. 


A.


B.


C

Saturday, November 2, 2013