Saturday, February 23, 2013

RTE.2.23.4 Waves and Spirals


"From Mead's point of view, the key to a more intuitive explanation of the universe lies in not only the interrelationships of matter and forces, but also a better understanding of the electron.

 "We need to treat the wave functions of our electrons as real wave functions," he said. "I have found personally that I had to go all the way back and reformulate the laws of electromagnetism, starting with the quantum nature of the electron as the foundation."


RTE.2.23.3 Constraints and Outputs

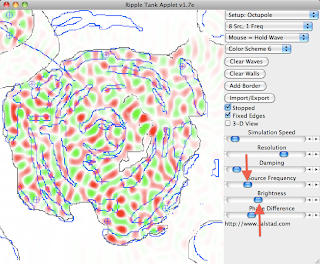
The blue lines are drawn after running for a while. They create areas of higher viscosity.  In Figure 4 the drawn grey lines are walls. 


Figure 1

Figure 2

Figure 3

Figure 4 - Addition of walls to emulate Constraints

Figure 4 and Time X

Figure 5. A small break in the wall within the oval at Time X + Y

RTE.2.23.2 Shape and Frequency


From figure 1 to 4 the frequency of the oscillators go from low to high. Changes were made serially, that is not going back to clean slate to begin different states.


Figure 1 
Figure 2 Frequency "ou"

Figure 3. Frequency "eq"


Figure 4. Frequency "cy"

If the upper wave emulates the Bwave and the lower the Rwave, perhaps the emerging patterns in the center are the vibrations in the Gspace, from which a G wave will emerge.


Friday, February 22, 2013

RTE.2.21.2 Sensitively Dependent on the Emotional State of the Observer

The following snapshots have precisely the same underlying patterns. The only difference are changes in the "Brightness" variable. The point is to demonstrate that a calm attitude is needed to Notice what is going on. Depending on the scale of the viewer, various opportunities can be seen or missed.


Figure 1

Figure 2
Figure 3


Figure 4


Thursday, February 21, 2013

RTE.2.21 Organizational Waste

Figure 1 Well functioning organization
Oval is area of  "output"

Figure 2
Environment has changed.
Note two oscillators at top left and right

Figure 3
Time X in new environment


Figure 4 
Time X + Y plus four pixels have been removed from wall at arrow


Figure 5 Time X + Y + Z
Notice shape at output oval.

The point is even very small leakage in a new environment can have significant effects on output

Monday, February 18, 2013

RTE.2.18.4

Figure 1 Frequency "S"


Figure 1 A - Frequency "s" at Time X


Figure 2 - Frequency "ce"

Figure 3 - Frequency "qu" 

Figure 4 - Frequency Maximum 

Figure 5 Brightness increased. Bubble begins.


Figure 6 - Brightness increases


Figure 7 Brightness Increases . Shape effectively disappears.


RTE.2.18.3 - History counts

Figure 1 Setup


Figure 2A. Frequency set at "re"


Figure 2 B. Frequency set at "re"


Figures 2A and 2B have precisely the same settings yet have obviously different patterns of flow.

In Figure 2B the patterns were created on an empty field. From no waves to frequency "eq." 

 Figure 2A patterns are the result of stepping through the following snapshots raising the frequency in smaller steps.

Figure 2A.1 - frequency set at "So"
Figure 2A. 2 Frequency set at "ce"


Figure 2A.3 Frequency set at "eq"


RTE.2.18


Figure 1


Figure 1 at Time X

The point is it seems possible with the control of only a few variables to create images that resonate with the real world.

Note the different outcomes with small changes in the blue lines.. ( lines of increased viscosity. )


Figure 3


Figure 3 at Time X

Note area at top to see density difference.